[TTTA] Episode 2 Hello Color Triangle

Hope you get all the points from the first episode!

If you are familiar with the real DX12 Hello Triangle sample, you might have noticed that the sample I created in episode 1 was incomplete. In this episode, we’ll delve into the full “Hello Triangle” sample and explore some new concepts to understand how to draw this more complete version.

Screenshots of this new sample will be included in this blog, but feel free to download latest version of Intel GPA and open S2-HelloColorTriangle.

From the result, we can find that the triangle is colorful, and background has been painted to blue. Also, the number of API log has been changed from 1 to 4, adding 3 new calls.

In this blog series, we’ll discuss “ResourceBarrier” in detail in a future episode. For now, it’s important to understand that a ResourceBarrier in DirectX 12 is used to synchronize resource states between different GPU operations. It ensures that resources are not read or written in an inappropriate state, which is critical for correct rendering and performance optimization. Think of it as a traffic controller that manages how different parts of the GPU access memory resources.

Let’s start with “ClearRenderTargetView“.

ClearRenderTargetView is a function from DX12 command list. Here from GPA we can easily observe what parameters this function need.

RenderTargetView: Represent the start of the heap to be cleaned

ColorRGBA[4]: a vector of float to represent a color

NumRect/PRects: The target vector of D3D12_RECT objects to be cleaned

If PRects is NULL, ClearRenderTargetView clears the entire resource view instead.

The purpose of this function to fill the entire render target with a single color. This is often used at the beginning of a new frame to clear the remnants of the previous frame’s rendering. Here, by having nullptr in PRects, we are setting up the entire frame to color [0, 0.2, 0.4, 1], a mixed color of blue and green. Since ClearRenderTargetView is before “DrawInstanced”, the cleared color becomes a background automatically.

Then, let’s go to the next section, DrawInstanced. It keeps almost everything the same as the one introduced in episode 1.

Shader Source Code(SH): Same as E1

Pipeline State/Non pipeline state: Same as E1

The only difference is the input vertices buffer.

Position0: Same as E1

Color0: In this example, 3 vertices of the triangle now has different color. Since color values are stored as the order of RGBA, we can tell that:

Index0: top middle (0, 0.44, 0), is red(1, 0, 0)

Index1: bottom left (0.25, -0.44, 0), is blue(0, 1, 0)

Index2: bottom right (-0.25, -0.44, 0), is green(0, 0, 1)

Thus, when we are drawing this triangle on the screen, we are drawing 3 vertices with different color. A question just comes to us: what will happen to the pixels that are in the middle? To well understand this, we will introduce one of the most important terms in computer graphics – Rasterization.

In a word, rasterization is responsible for converting geometry/vector images into pixel information. In our case, the geometry we input is the triangle. We input position and color information of 3 vertices here as a geometry of a triangle, and as for output we will get a set of all pixels that we find belong to the geometry shape, including each pixel’s position and color.

Rasterization process involves combinations of algorithms, and as a series focusing on communications between applications and GPUs, I am not planning to introduce all the math details here in this episode. For now, let’s only remember that a rasterization process can find all necessary pixels through a complex edge determination process, and interpolate all pixels’ color using the given colors.

Then let’s get back to the original question: Why having vertices of 3 different color will give us different colors in different position?

This is because of the algorithm we use in interpolation is Linear interpolation. specifically barycentric interpolation in modern 3D APIs. This method calculates the contribution of each vertex to the target point. For example, if a point is closer to a red vertex, the output will be more red. Each pixel has different distances to the three vertices, resulting in varied colors.

On the right is the process from ChatGPT, on calculating interpolation color value on pixel position (0.1, 0.1,0) in our case.

After calculation, we find the color in that area should be around (0.61,0.39,0,1).

In a graphics pipeline, before getting the final rendering result, there is another step calculating the pixel shader; however in pixel shader we just pass through the value to be the final result.

Here, let’s have a quick peek of the final result in the beginning. The white dot in the middle is (0,0,0,1). Thus, (0.1, 0.1, 0) is on the top right of the white dot, in Quadrant I. We can see that the color is between red and green, and more red; which indicates that our calculation result is correct.

This concludes this episode. I hope it gives you a better understanding of this colorful triangle. Rasterization is a significant topic in computer graphics, but grasping the concept and scope of rasterization is more important than understanding the underlying mathematics. In later episodes, we will continue this learning journey, exploring increasingly complex samples and introducing more concepts step by step.

[TTTA] Episode 1 Hello Triangle

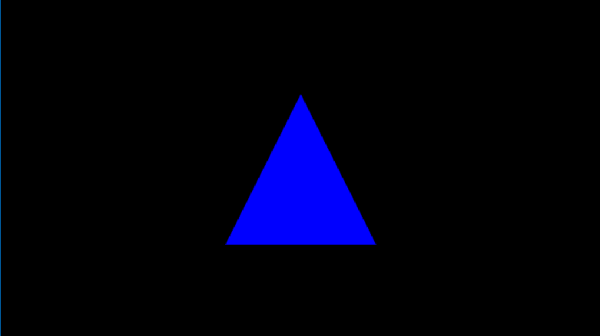
In the first episode, let’s talk about drawing a single triangle on your screen. By analyzing a frame captured from a triangle application, let’s learn what need to offer to the operating system to render this blue triangleIn our inaugural episode, we’ll explore how to render a single triangle on your screen. By examining a frame captured from a simple triangle-rendering application, we’ll learn about the essentials provided to the operating system to achieve this.

Begin by downloading “S1-HelloTriangle.zip” from the shared drive and extract its contents. Open the frame using the “Frame Analyzer” to proceed.

You’ll notice the blue triangle in the center—the outcome of our rendering. On the left, the API log lists just one item, signifying that a single “DrawInstanced” API call was responsible for rendering our triangle on the screen.

By selecting this draw call, a new “Resource” window appears, showcasing three categories: Input(In), Execution(Exe), and Output(Out). These resources are crucial for understanding the data required for rendering.

We will through those resources one by one to find out what has been used in this rendering.

Starting with the Input section, we find two items. ‘B:’ denotes a buffer, followed by a unique SHA code. The term ‘VBV’ (Vertex Buffer Views) indicates that this buffer stores the vertices.

This particular buffer contains a trio of vectors, each comprising two components: Position and Color.

Position: A trio of float vectors, each within the range of [-1.0, 1.0], designating the x, y, and z coordinates. For our 2D example, all z-values are zero, with the x/y pairs forming a triangle onscreen.

Color: A quartet of float vectors, ranging from [0.0, 1.0], representing the ‘RGBA’ color values where, in our case, we have full blue with complete opacity.

Why do colors define in floating points? While designing the interface, ideally an application doesn’t need to know what hardware it needs to be executed. Thus, when rendered in an 8-bit rendering system, the result color will be in range [0, 255]; on a 10-bit rendering system (Also named HDR10), it means the final range will be in [0, 1023].

Why colors and transparencies are defined on the vertices instead of the surface/triangle? In a modern rendering system, a surface is always represented by 3 vertices, and in general the number of surfaces will be larger than the number of vertices. In this case, defining color and transparency information on vertices can reduce the amount of parameter savings. The color and transparency values of a vertex are reused for all surfaces that share that vertex.

Geometry Input: A visual result of the input vertices, drawing a triangle in a 3D space.

That’s the end of Input section.

In execution section, to simplify this episode, we are only focusing on Arguments and Shader(SH):

ID3D12GraphicsCommandList::DrawInstanced: This is the draw command used in this rendering process. Definitions can be found here. ID3D12GraphicsCommandList::DrawInstanced

VertexCountPerInstance: Number of indices read from the index buffer for each instance.

InstanceCount: How many instances/surfaces are there in this draw call. Here we only have 1 triangles.

StartVertexLocation: Sometimes the vertex buffer saves additional information for other draw calls. Here offer an offset to find the correct vertex

StartInstanceLocation: A value added to each index before reading per-instance data from a vertex buffer.

From the DrawInstanced command’s arguments, we ascertain the intention to draw a single instance represented by three vertices.

Shader codes of this rendering system, as a programmable input to define how to render a result.

SH: 2555136722384 Shader resource, with its HASH

HLSL(High-Level Shader Language): A shader language developed by Microsoft

VSMain: The main function of Vertex Shader

PSMain: The main function of Pixel Shader. This will be the final value of a Pixel

The full design and execution of the shader system is complicated, and will be gradually extended in this series, when the demo is getting more complex. To check the full DX12 pipeline system Pipelines and Shaders with DX12.

And that wraps up the Execution section! We’ll touch upon the Output results when relevant in future discussions.

To recap, we’ve covered:

  • Input: Vertex positions and color data.
  • Shader: Source code specifying VSMain and PSMain functions.

With these inputs prepared, we’re set to execute the “DrawInstanced” command:

DrawIndexedInstanced(3, 1, 0, 0, 0)

Executing this function draws the blue triangle on the screen, achieving our rendering goal.

Thank you for joining Episode 1! Your thoughts and questions are welcome in the comments below. Stay tuned for the next installment!

Triangle-To-Triple-A Series – Intro

Step into the realm of game graphics with our comprehensive blog series, designed to empower you with a fundamental understanding of the modern graphics pipeline and the essence of graphics API calls. As we traverse the theoretical concepts, our narrative will be lightly sprinkled with practical examples, aiming to show how applications converse with the operating system to paint pixels on the screen—no heavy coding, just the pure science of graphics.

Within this series, we’ll occasionally reference Intel’s Graphics Performance Analyzers (GPA), a tool that exemplifies these concepts in action, though our focus will remain firmly on the underlying graphics principles rather than the intricacies of the tool itself. By the end of our journey, you’ll not only grasp the foundational elements of game graphics but also appreciate how they coalesce to form the breathtaking visuals in contemporary gaming.

Join us as we peel away the layers of complexity in modern graphics, clarifying the dialogue between application and machine, and illuminating the path from the genesis of a graphic call to the lush, immersive environments that define today’s gaming experiences.


All the frame/stream captures will be used in the blogs can be found under my shared one drive:

https://drive.google.com/drive/u/0/folders/1c8vXyConNvgtM43VnboaAlXCCb8He0ZO


Hope you can enjoy!

*May use the assistant with ChatGPT in the blog writing, but will review before publish:)

Graphics Software Engineer work categories

After joining Intel for some months, I collect different categories of works and positions here, and get to know the different focus people are on. As an End-to-end validation engineer, I am happy that I get a chance to work with different teams.

“Graphics Software Engineer” I mean here is not just for pure “Computer Graphics Appilication”, but more for “GPU Software Engineer”. Shader processing, rendering or calculating is not only in graphics related feature but more like in everywhere, so I am putting all relevant parts here, as a brief introduction on what we are expecting when we are speaking about graphics driver.

First of all, as a software engineer, GPU drivers are the most important things we take care. Below are different component teams working on different parts of a GPU driver.

  1. Kernel Mode Driver: Focusing on OS kernels, enable the new hardware in general operations, including memory management, power management, workload scheduling, ect.
  2. User Mode Driver – Graphics: For graphics area, there are 4 major graphics API drivers: [Vulkan, OpenGL, DirectX12, DirectX(*before12)]. Vulkan and OpenGL are generic for both Windows and Linux. DirectX is a graphics API provided and maintained by Microsoft for Windows systems. DirectX series are the most commonly used graphics API in the most popular games. DirectX12 is separated out is mainly because the change is huge. DirectX12 to DirectX10 is like Vulkan to OpenGL.
  3. User Mode Driver – Media: While playing videos or using video editing software, the driver handles encoding and decoding process. Note that sometimes media driver is using graphics APIs as well.
  4. User Mode Driver – Display: The rendering results will need to be shown on the connected display. This part is focusing on display protocols and data synchronizations.
  5. Compiler: Shader codes need to be compiled to be recognized and executed. We all know that OpenGL and other shader languages are designed to be compiled during the execution of applications, because the application never knows what the hardware to be installed on, but we also have situations that shader codes need to be compiled ahead of time. And also, specially for DirectX, shader codes are compiled twice. 1 time during compilation, 1 time during the compilation (to DXBC) and the other to the specific hardware.
  6. User Mode Driver – OpenCL: OpenCL is a common API across different platforms. This is the very basic part to design some GPGPU applications. Although it exists in both Linux and Windows, more and more modern solutions are popping out to replace it.
  7. User Mode Driver – Specialized high performance computing component (HCP): GPU provider specialized component. CUDA for Nvidia, OneApi for Intel, ect.
  8. System Control: Some GPU devices provide interfaces to control hardware system, like overclocking. Intel Arc Control provides you the ability to adjust overclocking during real-time.
  9. AI: In most cases it is not a separate component, but most likely to be a part of other user mode drivers. E.x. DirectML for AI on windows, Cuda/OneAPI for Linux, ect

TOBE CONTINUE… Pre & Post Silicon, hardware validation, software component validation, software tools, end to end validation.

OpenGL Learning resources, beginner to master

Here are the learning resources I have been using for OpenGL in work & self study.

Learn as a beginner

Video Tutorial: (For domain knowledge)
The Cherno OpenGL series: https://www.youtube.com/playlist?list=PLlrATfBNZ98foTJPJ_Ev03o2oq3-GGOS2

The best OpenGL Tutorial so far. Explanations are clear and accurate, babysat me through the headache times:)

No need to follow every coding part as he was doing, since the version of OpenGL may be different. (My work is mainly focus on OpenGL ES). The main idea is understand how graphics pipeline works, understand the meanings of the main terms like VAO, VBO, EBO, and get familiar with common APIs for draw shapes or textures.

Website: https://learnopengl.com/

Best learning website with all needed knowledge and codes. Have been following this website to do all the practices. Each lesson includes detailed explanations and corresponding codes that I can directly have some hands-on test.

Learn from your favorite applications

Graphics technology is widely used in different kinds of applications, especially in games. To understand how your favorite application is rendering beautiful scenes on the screen, here are 2 main tools(Open source project) you can refer:

  1. Gapid

Github link: https://github.com/google/gapid

Document page: https://gapid.dev/about/

Powerful tool developed and maintained by Google.

2. Renderdoc

Main page: https://renderdoc.org/

Github link: https://github.com/baldurk/renderdoc

Document page: https://renderdoc.org/docs/index.html

Note that for both tools, only supported API can be captured. They have great support in some kinds like Android mobile games developed in Unreal or Unity, but not all applications are easy to captured.

After getting a trace, you can review the opengl function calls and see how they are drawn and rendered as the final result.

Where to find more sample projects?

If you google OpenGL examples, you will only find some old, simple and duplicated examples, even the https://learnopengl.com/ website can offer better examples. But if you want to draw something very fancy, with very complicated effects, there is a special kind of OpenGL ES called WebGL, which uses pretty much similar APIs like real OpenGL shaders but slightly different.

By opening WebGL applications, it will render the shaders in your browser(Or other platforms like VS codes). There is a website that stores many WebGL projects that you can easily see the codes and final results with real-time rendering on web pages:

ShaderToy: https://www.shadertoy.com/

Exmaple:

ShaderToy provides tons of beautiful projects that can be running on your computer by a single click! This is also a very good tool for shader coders that they can see the render scenes in real-time. Also, you can transform it easily back to traditional OpenGL shaders easily, by using WebGL shaders as fragment shader and putting a passthrough vertex shader.(Some changes on API is needed)

Those are some resources helping me a lot in my daily work and study. It’s 2021 and thanks to the internet I don’t need to buy a textbook or pay for a course. I Feel free to leave a comment if you find some other resources that really helpful in studying OpenGL or useful in your daily work. I will keep this page updated while I find new things that improves my skills.

Blog at WordPress.com.

Up ↑